Cumulative & Burndown
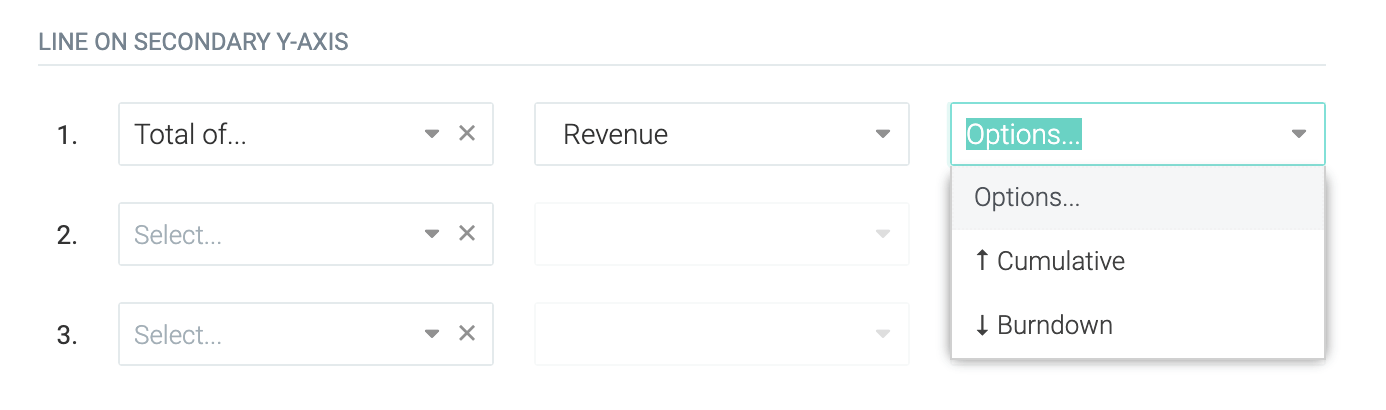
Celoxis enables you to create your own S-curves and Burndown charts. This is possible by using the Cumulative and Burndown options in the Line on Secondary Y-Axis section in a bar chart as shown below.
We shall understand these options using a simple example.
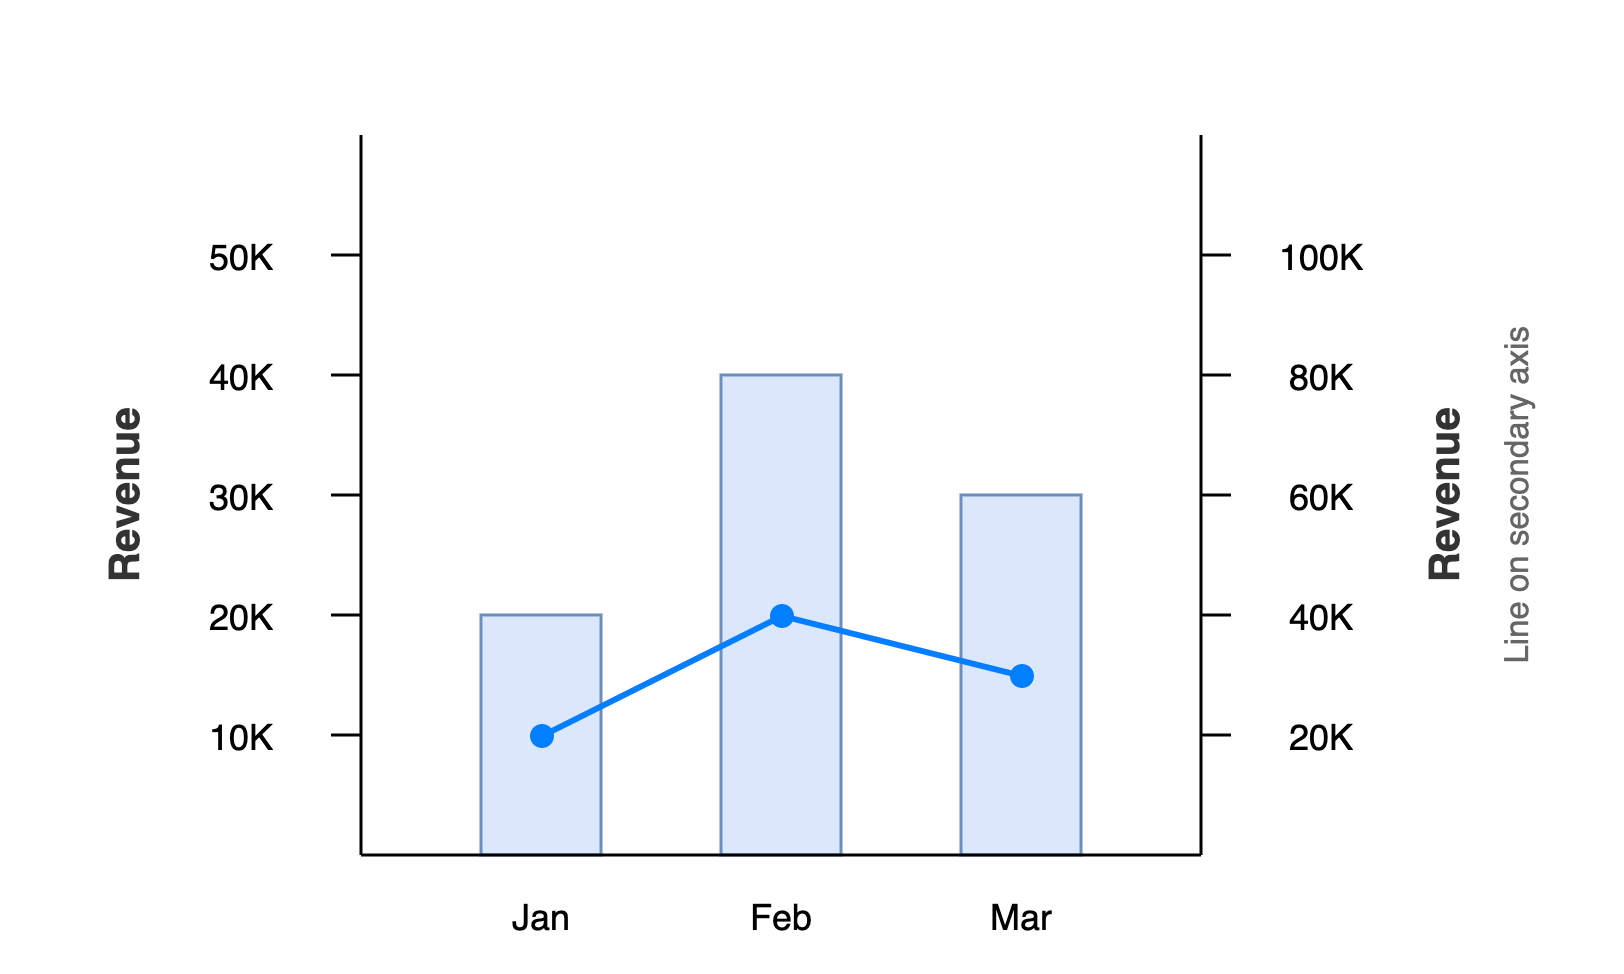
Let's say that we have the following data set and we are drawing a bar chart with Revenue on the Y-axis and a line, also of revenue, on the secondary Y-axis
| Month | Revenue |
|---|---|
| Jan | 20K |
| Feb | 40K |
| Mar | 30K |
The chart would look like ⟶
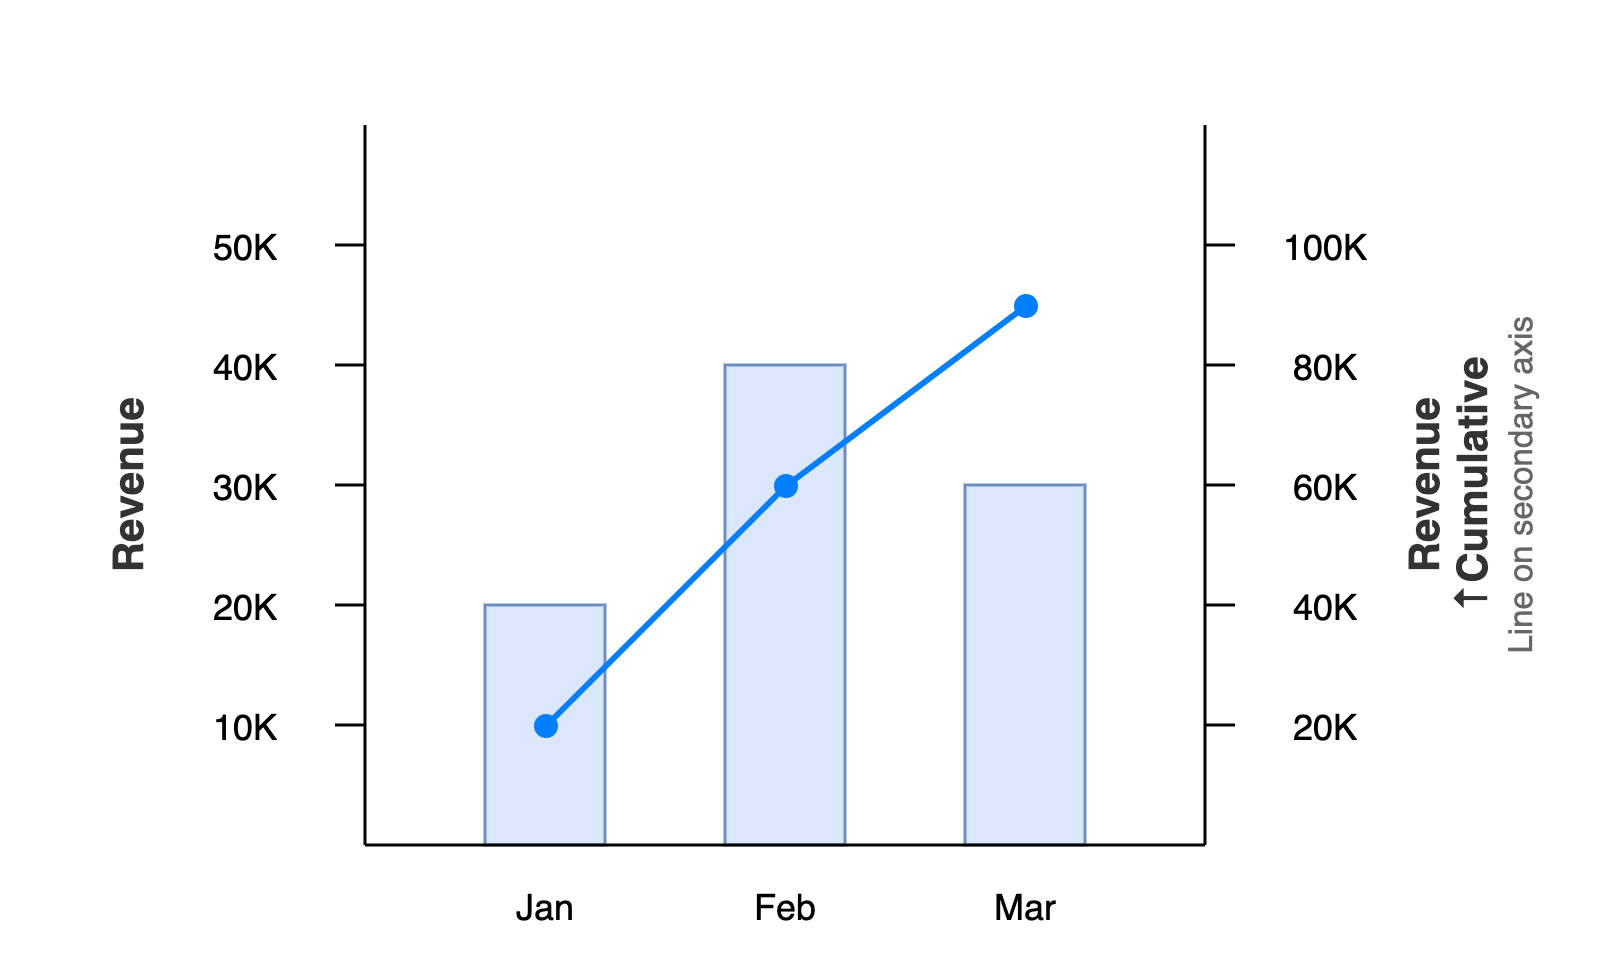
Cumulative
This means that each value of the line is the sum of the current value plus the sum of all previous values. The cumulative values would be:
| Month | Revenue | Cumulative |
|---|---|---|
| Jan | 20K | 20K |
| Feb | 40K | 40K |
| Mar | 30K | 70K |
The chart would look like ⟶
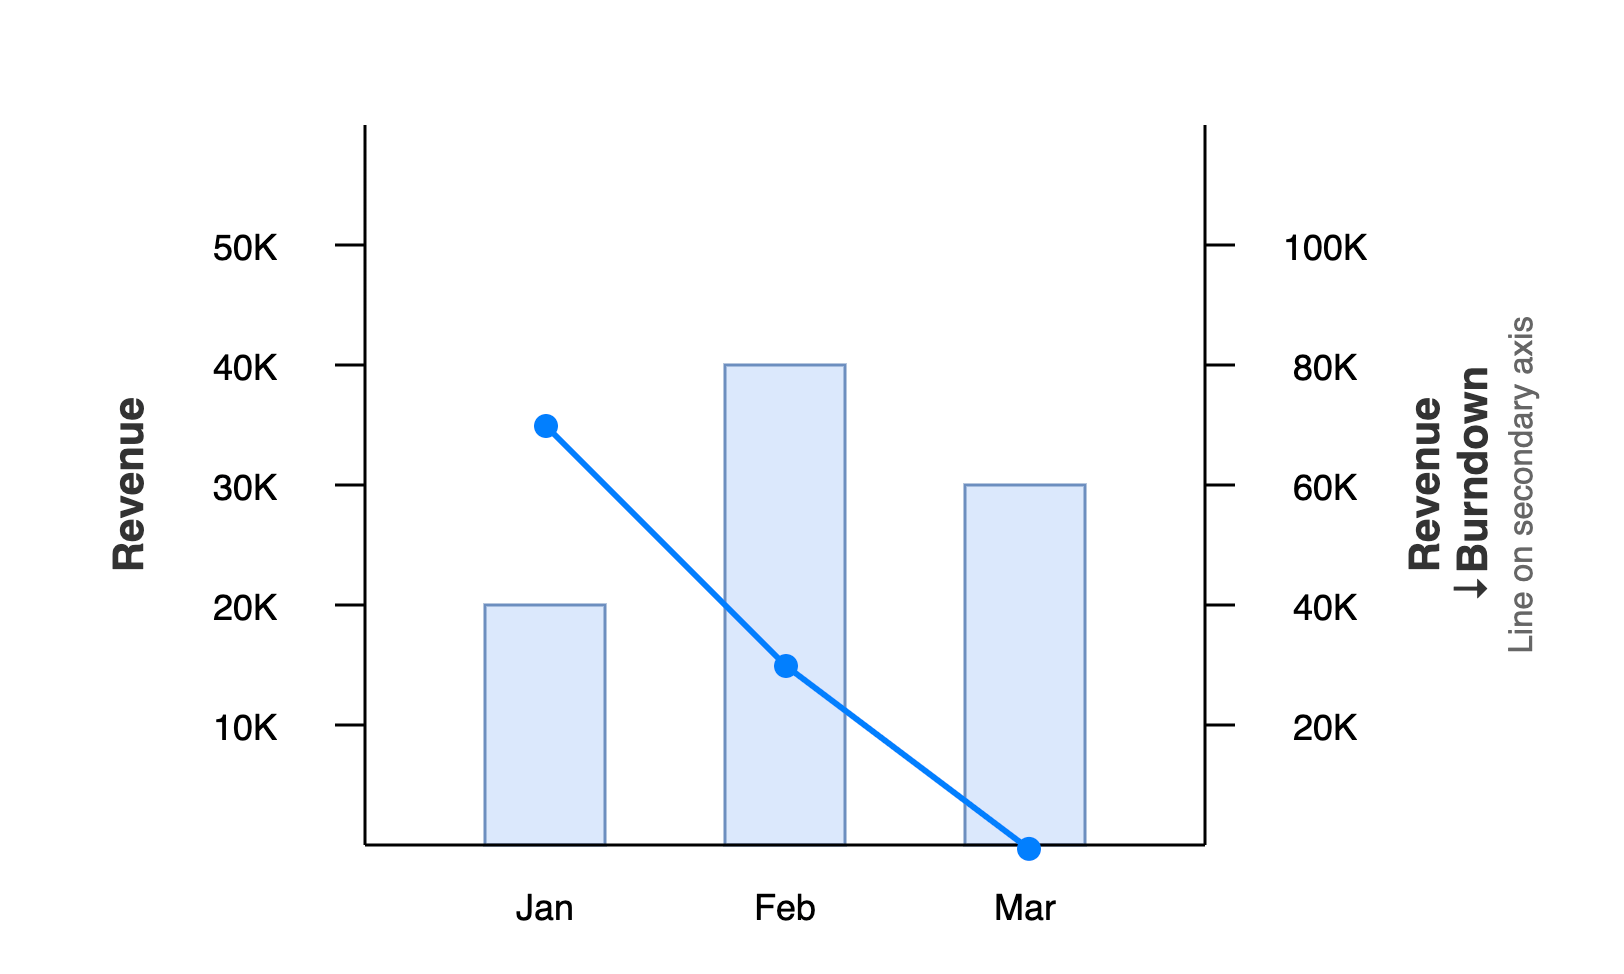
Burndown
This means that each value of the line is the sum of all values in the data set - the sum of all values till the current data point. The values would be:
Sum of all values = 90K
| Month | Revenue | Burndown |
|---|---|---|
| Jan | 20K | 70K |
| Feb | 40K | 30K |
| Mar | 30K | 0K |
The chart would look like ⟶